A YouTube ad revenue calculator helps creators estimate their potential earnings based on views, CPM, and audience engagement. By using this tool, you can quickly calculate how much revenue your channel may generate from ads. It’s an essential resource for planning content strategy and maximizing YouTube monetization.
Data sources: YouTube Partner Program Monetization Policies
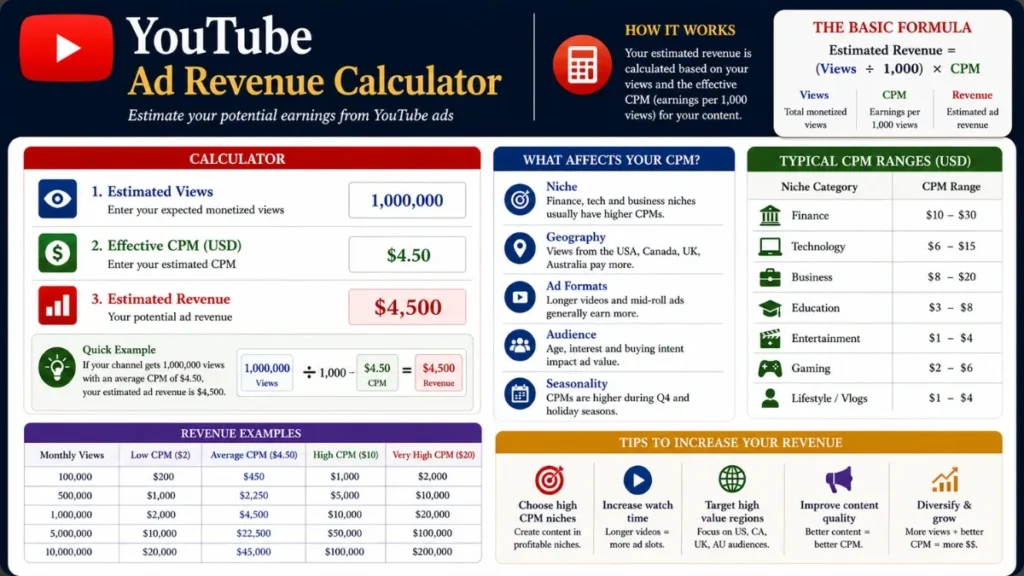
YouTube Ad Revenue Calculator 2026
Estimate monthly and yearly YouTube earnings using real 2026 CPM and RPM benchmarks. Enter your views, choose your niche, see your number.
YouTube CPM & RPM Rates by Niche
Your content niche is the single biggest lever on earnings. A finance creator can earn 15× more per view than a gaming creator at the same view count. Here’s the full 2026 global breakdown.
| Niche | CPM Range (Global) | Creator RPM | Tier | Views to $1K/mo |
|---|---|---|---|---|
Insurance / Legal | $30–$65 | $18–$24 | S | ~43K |
Finance & Investing | $20–$60 | $15–$20 | S | ~56K |
B2B / SaaS / Business | $20–$45 | $12–$16 | A | ~71K |
Technology Reviews | $12–$28 | $8–$12 | A | ~100K |
Education & Tutorials | $10–$25 | $6–$9 | A | ~133K |
Health & Fitness | $8–$20 | $5–$8 | B | ~167K |
Food & Cooking | $5–$14 | $3.5–$5.5 | B | ~250K |
Travel & Lifestyle | $4–$12 | $3–$5 | B | ~286K |
Gaming | $4–$15 | $2.5–$4 | C | ~333K |
General Entertainment | $2–$8 | $1.5–$3 | C | ~500K |
Music | $1–$4 | $0.80–$1.50 | C | ~833K |
How YouTube Ad Revenue Works in 2026
YouTube’s ad model involves advertiser auctions, platform revenue share, content flags, and seasonal swings. Here’s everything creators worldwide need to understand.
YouTube CPM vs RPM: Know the Difference
CPM is what advertisers pay per 1,000 ad impressions. RPM is what you actually earn per 1,000 total views after YouTube’s 45% cut and after subtracting non-monetized views from ad blockers. Always use RPM from your YouTube Analytics dashboard as your real earnings benchmark.
Seasonal Revenue Swings
Q4 (Oct–Dec) is peak season globally. Holiday ad spending pushes CPMs 25–35% above annual averages. January CPMs can plunge 30–50% as budgets reset. Organizing your publishing calendar around Q4 can meaningfully boost annual earnings without extra views.
Why Audience Location Matters
Viewers from tier-1 markets like the US, UK, Canada, and Australia generate significantly higher CPMs due to larger digital ad markets and stronger purchasing power. A channel with predominantly US traffic can earn 5–10× more per view than one with primarily South or Southeast Asian traffic.
The Ad-Blocker Revenue Gap
An estimated 25–40% of desktop YouTube viewers use ad blockers globally. Those views generate zero ad revenue. Mobile and CTV (smart TV) viewers have far lower block rates, one reason why CTV placements command a premium and savvy creators are optimizing for big-screen audiences.
YouTube Shorts: The Discovery Engine
Shorts RPMs are a fraction of long-form ($0.01–$0.06) due to the Creator Pool model and music licensing costs. The winning strategy in 2026: use Shorts for subscriber discovery, then convert those viewers into high-value long-form watch time where real CPM dollars are captured.
YouTube Partner Program (2026)
Full ad revenue requires 1,000 subscribers + 4,000 watch hours in 12 months (or 10M Shorts views in 90 days). Basic monetization via memberships and Super Chats unlocks earlier at 500 subscribers + 3,000 watch hours. Tax forms and address verification are required after approval.
Frequently Asked Questions
-
Globally, the average creator RPM for long-form videos ranges from $1 to $12 per 1,000 views, depending on niche and audience location. Tier-1 markets like the US, UK, Canada, and Australia command the highest CPMs. After YouTube’s 45% platform cut and non-monetized views (ad-blocked or ineligible views), most creators receive 40–55% of the gross CPM as their actual RPM. Finance and insurance channels regularly see RPMs of $15–$22, while gaming or general entertainment channels typically earn $2.50–$4 RPM.
-
CPM (Cost Per Mille) is the price advertisers pay per 1,000 ad impressions, it is an advertiser-facing metric. RPM (Revenue Per Mille) is the actual income a creator receives per 1,000 total video views after YouTube deducts its 45% share and after all non-monetized views are excluded. RPM is visible in your YouTube Analytics dashboard and is the metric that matters for budgeting and revenue forecasting. If the CPM is $20, your RPM will typically be $8–$11.
-
Finance, Investing, and Insurance are the top-paying niches. CPMs in these sectors regularly hit $40–$60, while insurance and legal content can exceed $65 CPM in high-value markets. The reason is straightforward: a converted viewer is worth thousands to a bank, insurer, or law firm (so advertisers in those sectors bid aggressively). B2B/SaaS ($20–$45 CPM) and Technology Reviews ($12–$28 CPM) rank closely behind.
-
It depends on your niche and your audience’s location. At an average global RPM of $2–$5, you need around 200,000–500,000 monetized views per month. For high-CPM niches like finance at $15–$20 RPM, only 50,000–67,000 monthly views may suffice. For gaming at $2.50–$4 RPM, you might need 250,000–400,000 views. This is why niche selection and audience geography have far more leverage on earnings than chasing raw view counts.
-
This is a universal, predictable pattern. Advertisers exhaust Q4 holiday budgets by December 31st, and Q1 budgets reset at significantly reduced levels. CPMs can drop 30–50% in January compared to the December peak across all major markets. Recovery typically happens through Q2 (April–May) as brands deploy remaining spend. Experienced creators treat January as an experimentation period, saving their best content ideas for Q3–Q4 when advertiser demand and their CPMs peak.
-
For standard long-form videos, YouTube retains 45% of gross ad revenue and passes 55% to the creator. For YouTube Shorts, the model is different: ad revenue flows into a Creator Pool that first covers music licensing costs. Individual creator payouts are then distributed proportionally based on each creator’s share of total eligible Shorts views in their country. This structure results in dramatically lower RPMs for Shorts ($0.01–$0.06) compared to long-form content.

(Qualified) Chartered Accountant – ICAP
Master of Commerce – HEC, Pakistan
Bachelor of Accounting (Honours) – AeU, Malaysia